

Business Performance Highlights
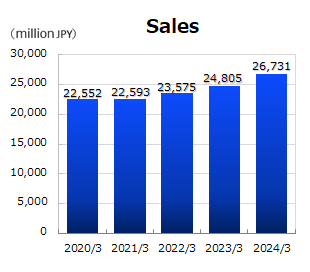
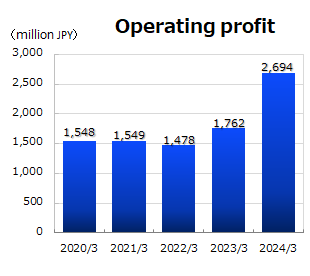
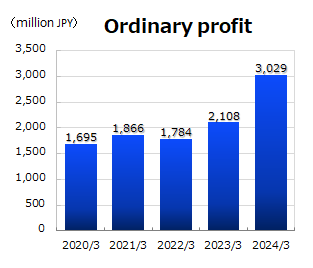
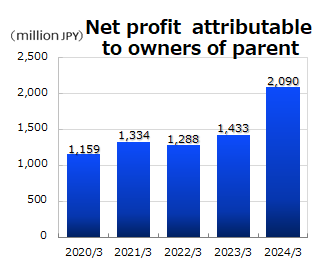
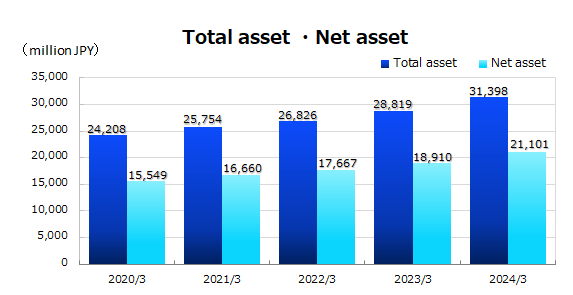
Key Business Performance Data(Unit: million JPY)
| 2019/3 | 2020/3 | 2021/3 | 2022/3 | 2023/3 | |
|---|---|---|---|---|---|
| Sales | 22,350 | 22,552 | 22,593 | 23,575 | 24,805 |
| Operating profit | 1,725 | 1,548 | 1,549 | 1,478 | 1,762 |
| Ordinary profit | 1,887 | 1,695 | 1,866 | 1,784 | 2,108 |
| Net profit attributable to owners of parent |
1,289 | 1,159 | 1,334 | 1,288 | 1,433 |
| Total asset | 23,615 | 24,208 | 25,754 | 26,826 | 28,819 |
| Net asset | 14,830 | 15,549 | 16,660 | 17,667 | 18,910 |