

Management Indicators
Management Indicators as Togami Group
| 2020/3 | 2021/3 | 2022/3 | 2023/3 | 2024/3 | |
|---|---|---|---|---|---|
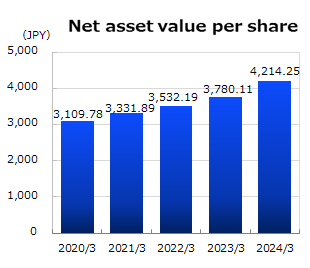
| Net asset value per share (JPY) | 3,109.78 | 3,331.89 | 3,532.19 | 3,780.11 | 4,214.25 |
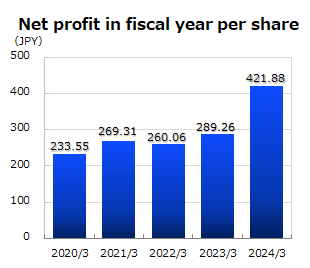
| Net profit in fiscal year per share (JPY) | 233.55 | 269.31 | 260.06 | 289.26 | 421.88 |
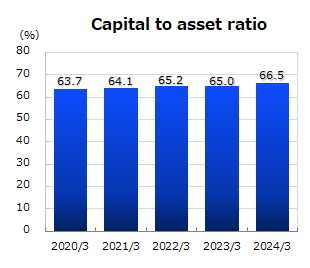
| Capital to asset ratio (%) | 63.7 | 64.1 | 65.2 | 65.0 | 66.5 |
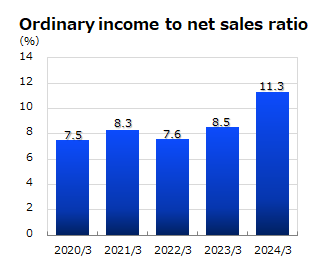
| Ordinary income to net sales ratio (%) | 7.5 | 8.3 | 7.6 | 8.5 | 11.3 |
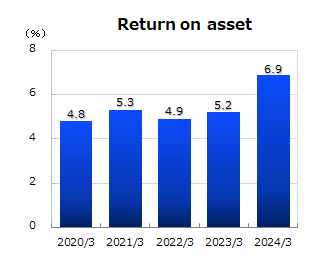
| Return on asset (%) | 4.8 | 5.3 | 4.9 | 5.2 | 6.9 |
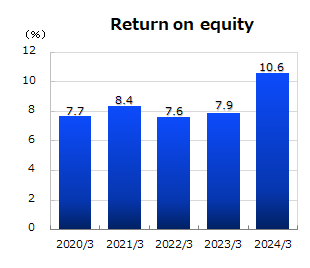
| Return on equity (%) | 7.7 | 8.4 | 7.6 | 7.9 | 10.6 |